Volume Map by QTECHtrading
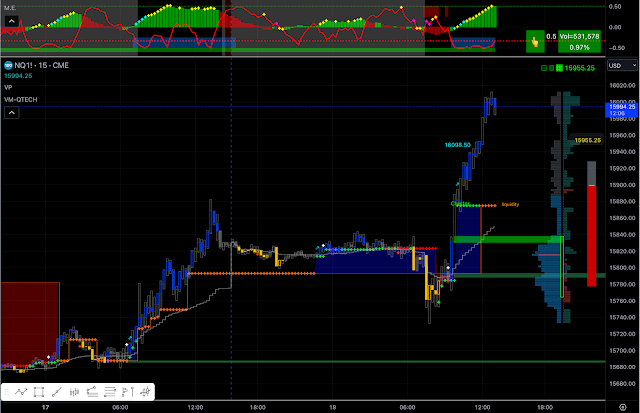
Volume Map by QTECHtrading (for Day Traders only) As the name suggests, Volume Map reveals volume nodes on TRADINGVIEW similar to BOOKMAP. The algorithm of this indicator weighs the volume and price level to convert data and map out key information in a simple way, eliminating the need for constant manual calculations. It displays buying order blocks , selling order blocks , Buying / Selling Order clusters , and an O range line on the right side of the chart for trading purposes. The Orange line ( LIQUIDITY ) serves as a gauge for Buying VS Selling. When the price is above, there is a higher chance of long success, and vice versa. The Green+ / Red+ CROSS ( Buying / Selling order clusters ) indicate leading volume in a particular direction. For instance, if a Green Cross appears at the same location as the Orange line and deviates higher, it indicates a higher volume associated with the long position in the buying block (the green cloud box) . Conve...