Volume Map by QTECHtrading
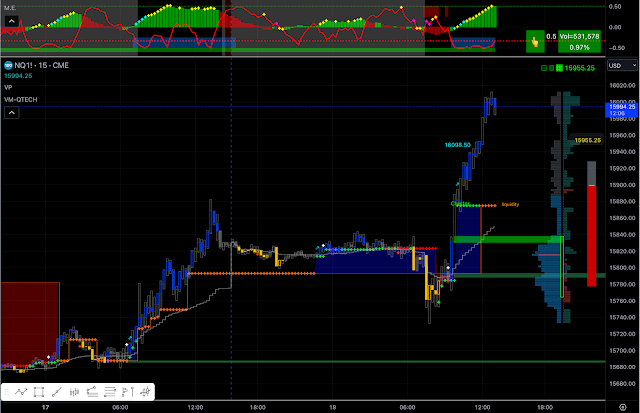
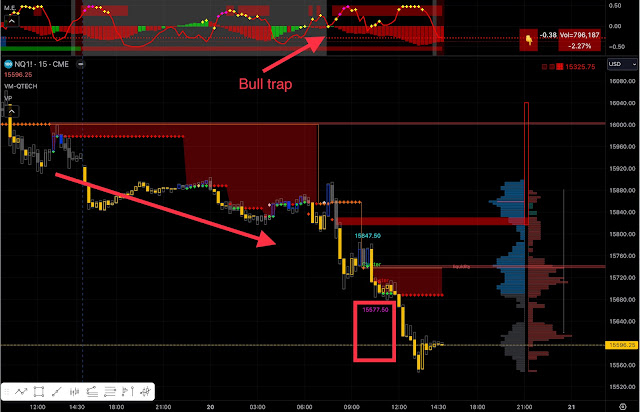
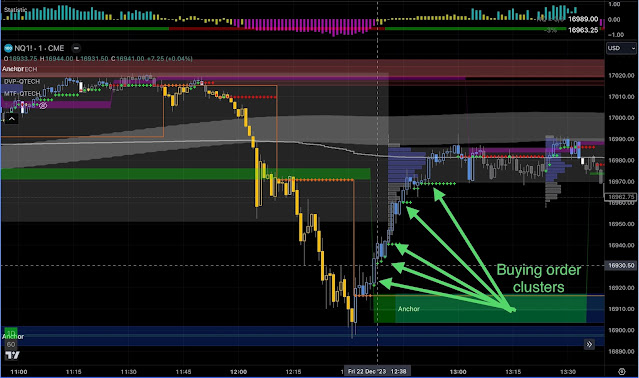
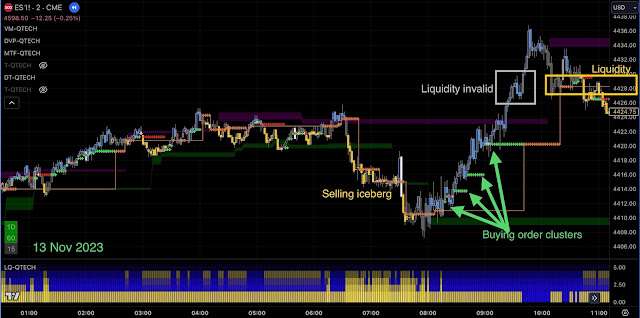
Volume Map by QTECHtrading (for Day Traders only) As the name suggests, Volume Map reveals volume nodes on TRADINGVIEW similar to BOOKMAP. The algorithm of this indicator weighs the volume and price level to convert data and map out key information in a simple way, eliminating the need for constant manual calculations. It displays buying order blocks, selling order blocks, Buying/Selling Order clusters, and an Orange line on the right side of the chart for trading purposes. The Orange line (LIQUIDITY ) serves as a gauge for Buying VS Selling. When the price is above, there is a higher chance of long success, and vice versa. The Green+/Red+ CROSS (Buying/Selling order clusters) indicate leading volume in a particular direction. For instance, if a Green Cross appears at the same location as the Orange line and deviates higher, it indicates a higher volume associated with the long position in the buying block (the green cloud box). Conversely, if a Red Cross appears at the same location as the Orange line and deviates lower, it suggests a higher volume associated with the short position in the selling block (the red cloud box).
- Analyze Market Depth: Volume Map allows you to see the depth of the market by visualizing the liquidity through the Orange line, buying block (the green cloud box), selling block (the red cloud box). Pay attention to the order clusters indicated by Green+/Red+ CROSS, Orange line, buying block (the green cloud box)/selling block (the red cloud box) to understand where the market may be headed.
- Identify Key Price Levels: Look for areas on the chart where significant buying or selling pressure is present. These areas, represented by the buying block (the green cloud box) and selling block (the red cloud box), can act as support or resistance levels.
- Watch Order Flow: Monitor the incoming order flow in real-time. Observe the aggressiveness of buyers and sellers, large market orders, and Green+/Red CROSS ++++++ orders to gauge the strength of the market participants.
- Spot Market Reversals: Keep an eye out for order flow shifts or significant changes in the liquidity represented by the Orange line, which may signal a potential market reversal. Look for absorption of orders or the emergence of new liquidity at key levels.
- Consider Context: Take into account the overall market conditions, news events, and other relevant factors that may impact price movements. Use Volume Map as a complementary tool to your existing trading strategy.


Comments
Post a Comment