Posts

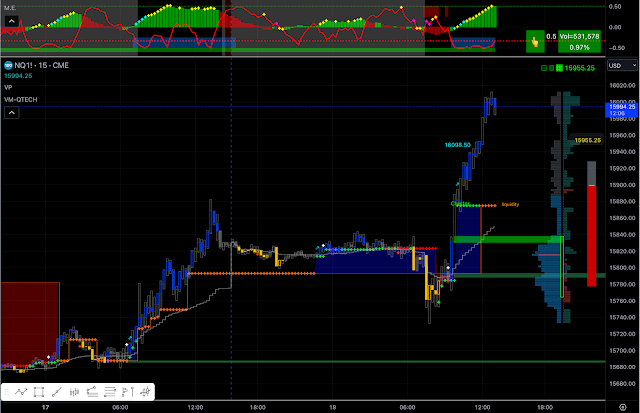
Volume Map by QTECHtrading
Image
Volume Map by QTECHtrading (for Day Traders only) As the name suggests, Volume Map reveals volume nodes on TRADINGVIEW similar to BOOKMAP. The algorithm of this indicator weighs the volume and price level to convert data and map out key information in a simple way, eliminating the need for constant manual calculations. It displays buying order blocks , selling order blocks ,  Buying / Selling   Order clusters , and an O range line on the right side of the chart for trading purposes. The Orange line  ( LIQUIDITY ) serves as a gauge for Buying VS Selling. When the price is above, there is a higher chance of long success, and vice versa. The Green+ / Red+ CROSS  ( Buying / Selling order clusters ) indicate leading volume in a particular direction. For instance, if a Green Cross appears at the same location as the Orange line and deviates higher, it indicates a higher volume associated with the long position in the buying block (the green cloud box) . Conve...

Statistic Indicator

Image
The Statistic Indicator is a sentimental indicator for S&P ES SPY/ NASDAQ NQ QQQ/ HangSeng Index HSI.  It is one of three factors for trading, which are  Price Action, Location, and Sentiment. Knowing the components of the NASDAQ 100 when trading NQ futures provides traders with valuable insights into risk management, sector analysis, volatility considerations, liquidity assessment, and event risk management. By staying informed about the underlying stocks that drive index movements, traders can make more informed decisions and navigate the futures market with greater confidence The indicator calculates the statistic of the stocks on S&P/NASDAQ and presents them in a simple visual graphic. This is statistical summarized version of the HEAT MAP  on Tradingview Heat Map of the stock exchanges with two dimensional grid, with one axis representing listed stock, and other axis representing time. Each cell in the grid is assigned a color based on the corresponding dat...

Market Engine Indicator

Image
  Market Engine Indicator is designed for trading on the right side of the fence. Jesse Livemore "There is only one side to stock market; and it is not the bull side or the bear side, but the right side" Market engine is a technical indicator that Shows momentum in histogram and negative momentum line. - upside : momentum histogram > negative momentum (red)-line - downside : momentum histogram < negative momentum (red)-line green histogram - more buyers ( watch out trap long when downside condition) red histogram - more sellers ( watch out trap short when upside condition) When market is extending , M.E. informs user with Blue cloud (no short) or Red cloud (no long) Market Engine is simplified indicator and suitable for day trade, swing trade and investing.  Market Engine combines Dynamic Trend Channels  to provide another level of the market on three main factors of trading, Location , Price Action , and Sentiment . A top-down approach for day trade involv...

Day Trade Market Condition

Image
Day Trade Market Condition , update daily on Tradingview community trade idea.  Jesse Livemore "There is only one side to stock market; and it is not the bull side or the bear side, but the right side" : NQ, ES, CL , BTC (a day trader on NQ, markets I pay attention with); The following systematically generates levels throughout the day in a slightly unconventional format.  The purpose of these levels is to avoid OVERTRADING and to TRADE with the TREND. The programming behind the levels is Volume Profile. How to use these levels? Focus on two trends: the Primary for swing and Short term (for Day Traders) shown in a table. - Short term "Rally" favors LONG, while "Drop" favors short. In between is the "SHOP zone" where prices can travel between supply and demand levels set by market makers. - Primary trend is for swing trading on a higher time frame. When it's a "BULL" trend, the days are up, and when it's a "BEAR" trend,...