Posts

Day trading system

Image
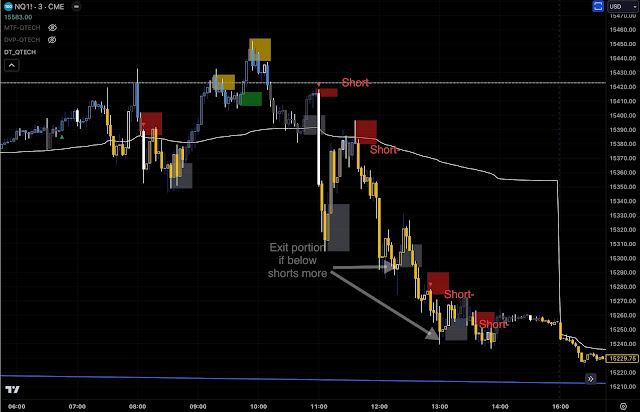
Day trading system by Day Price Trend indicator this is a price-action indicator applying Dow theory for day trading, with additional of a VWAP line for contextualizing market sentiment.  Green Box--Price higher highs  Gray Box--Price lower highs  Red Box--Price lower lows  Yellow Box--Price lower highs  Day trading during a balance day is unfavorable; it's better suited for trending days with imbalance. With advance understanding of market structure is required.  Additional information on my blog. Go long conservatively when up arrows appear, then exit box occurs; stop under green box  Short when down arrows appear and take profit gray box; stop above red box 
Apply Volume Profile

Image
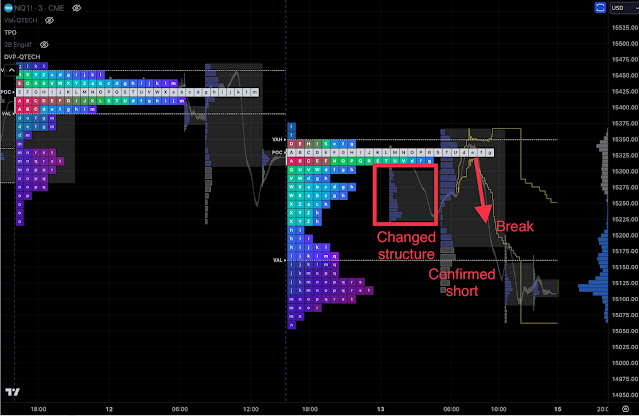
 Apply Volume Profile in a simplified way Dynamic Volume Profiles : Dynamic Volume Profile is a versatile tool for TradingView that provide traders with valuable insights into market activity.  1. **Automatic Calculation**: Dynamic Volume Profiles generated a series of profile for each cycle of market participants. By comparing the profile at a particular point on the chart, traders can analyze volume distribution within that defined region, providing insights into market activity at that specific level. 2. **Identification of Key Levels**: They help identify key support and resistance levels. Traders can spot areas where significant volumes were traded, signifying areas where the market has shown interest. These levels can act as strong support or resistance. 3. **Validation of Breakouts**: Dynamic Volume Profiles can validate the strength of price breakouts. When a price breaks through a region with high volume, it's often seen as a stronger breakout compared to one with lo...

The Significance of Price Action and Volume in Trading

Image
   In the world of trading, successful traders understand that relying on indicators or searching for magic solutions is not the key to profitable trades. Instead, the focus should be on two critical elements: price action and volume. By delving into these aspects, traders can gain valuable insights into market strength, identify the aggressors, and make informed decisions. This post idea will explore the importance of price action and volume, the role of indicators, the concept of volume, the auction market theory, the influence of economic factors, and the synergy of price action and volume analysis. In trading, it is crucial to prioritize price action and volume over a reliance on indicators or supposed magical indicators. Indicators often fail to capture the complexity of market dynamics, while price action and volume provide tangible insights into market behavior. These two factors become the foundation for understanding market strength, trends, breakouts, and breakdowns....

Volume Map by QTECHtrading

Image
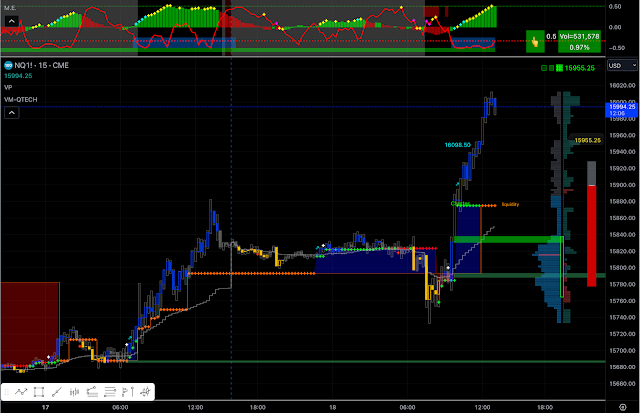
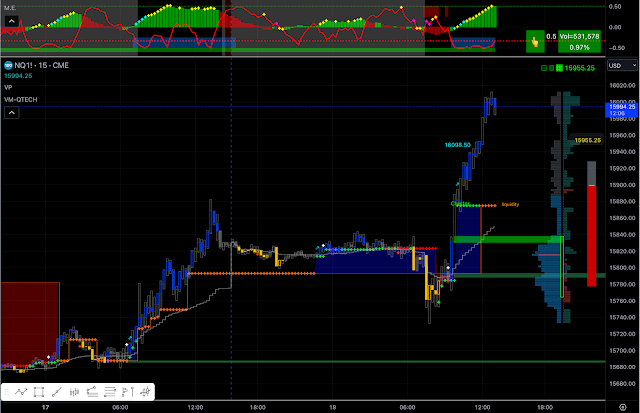
Volume Map by QTECHtrading (for Day Traders only) As the name suggests, Volume Map reveals volume nodes on TRADINGVIEW similar to BOOKMAP. The algorithm of this indicator weighs the volume and price level to convert data and map out key information in a simple way, eliminating the need for constant manual calculations. It displays buying order blocks , selling order blocks ,  Buying / Selling   Order clusters , and an O range line on the right side of the chart for trading purposes. The Orange line  ( LIQUIDITY ) serves as a gauge for Buying VS Selling. When the price is above, there is a higher chance of long success, and vice versa. The Green+ / Red+ CROSS  ( Buying / Selling order clusters ) indicate leading volume in a particular direction. For instance, if a Green Cross appears at the same location as the Orange line and deviates higher, it indicates a higher volume associated with the long position in the buying block (the green cloud box) . Conve...

Statistic Indicator

Image
The Statistic Indicator is a sentimental indicator for S&P ES SPY/ NASDAQ NQ QQQ/ HangSeng Index HSI.  It is one of three factors for trading, which are  Price Action, Location, and Sentiment. Knowing the components of the NASDAQ 100 when trading NQ futures provides traders with valuable insights into risk management, sector analysis, volatility considerations, liquidity assessment, and event risk management. By staying informed about the underlying stocks that drive index movements, traders can make more informed decisions and navigate the futures market with greater confidence The indicator calculates the statistic of the stocks on S&P/NASDAQ and presents them in a simple visual graphic. This is statistical summarized version of the HEAT MAP  on Tradingview Heat Map of the stock exchanges with two dimensional grid, with one axis representing listed stock, and other axis representing time. Each cell in the grid is assigned a color based on the corresponding dat...